Check Out Some of My Works
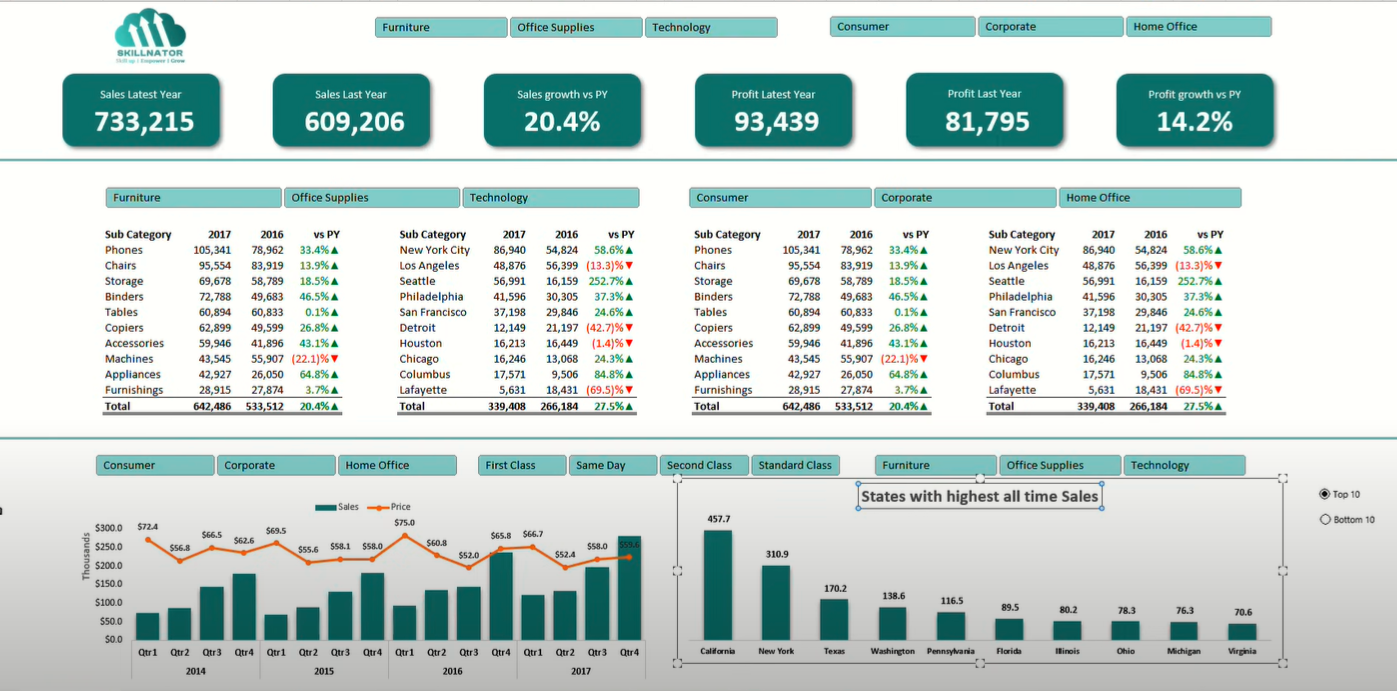
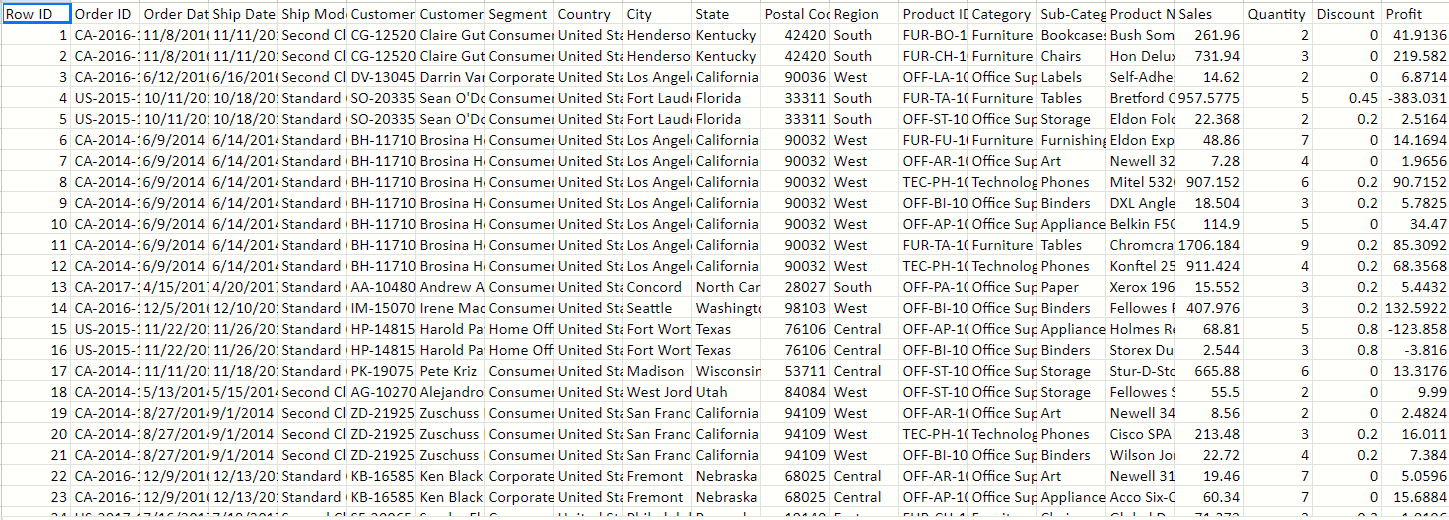
The objective of the Interactive Superstore Sales Dashboard is to provide a comprehensive overview of the company's sales and profitability performance over a 4-year period (2013 to 2018). The dashboard aims to help stakeholders make informed decisions by visualizing sales trends, analyzing key business metrics, and identifying areas of growth or decline across various segments, categories, cities, and shipping modes. The interactive nature of the dashboard allows users to drill down into data for deeper insights.
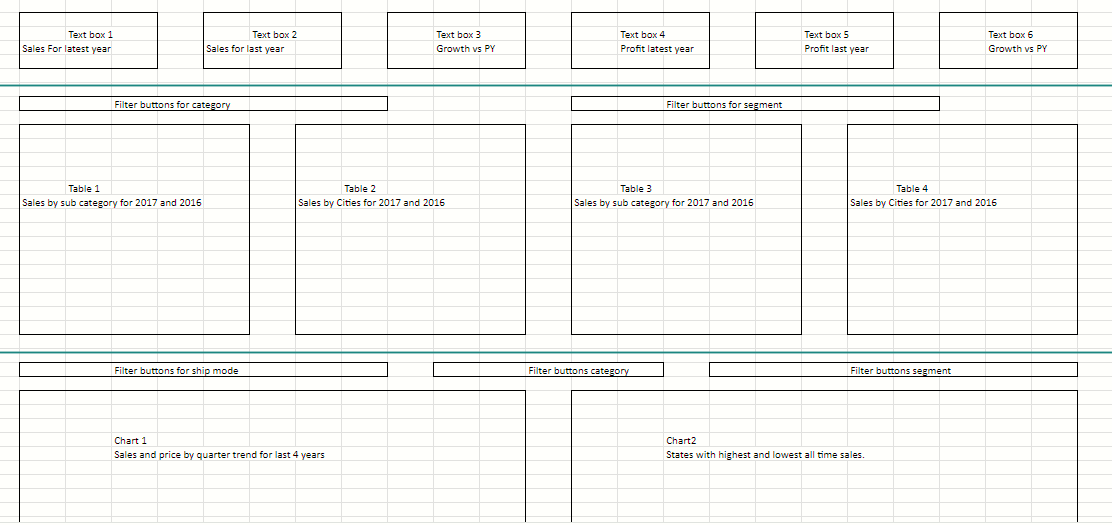
Pivot Tables: Used to organize sales data by categories, sub-categories, cities, and customer segments.
Data Tables: For displaying year-over-year sales data and growth percentages.
Charts: Line and bar charts for visualizing trends (e.g., sales by quarter and state performance).
Slicers/Filters: Interactive filters to allow users to adjust the data displayed by segment, category, and shipping mode.
Conditional Formatting:
Applied to highlight growth (green) and declines (red) across categories, sub-categories, and cities, helping users quickly identify performance changes
Formulas:
Used for calculating growth percentages and other key metrics like profit growth vs the previous year
Key Performance Indicators (KPIs):
Sales & Profit Comparison: Displays sales and profit for the latest year, previous year, and the percentage growth year-over-year.
Growth Metrics: Highlights growth percentages for both sales and profit, helping users track the performance trajectory over time.
Sales & Profit Breakdown:
By Product Sub-Category: Shows detailed sales data for sub-categories such as Phones, Chairs, Storage, Appliances, etc., with year-over-year comparisons.
By City: Displays sales data for major cities, allowing users to analyze regional performance.
Charts:
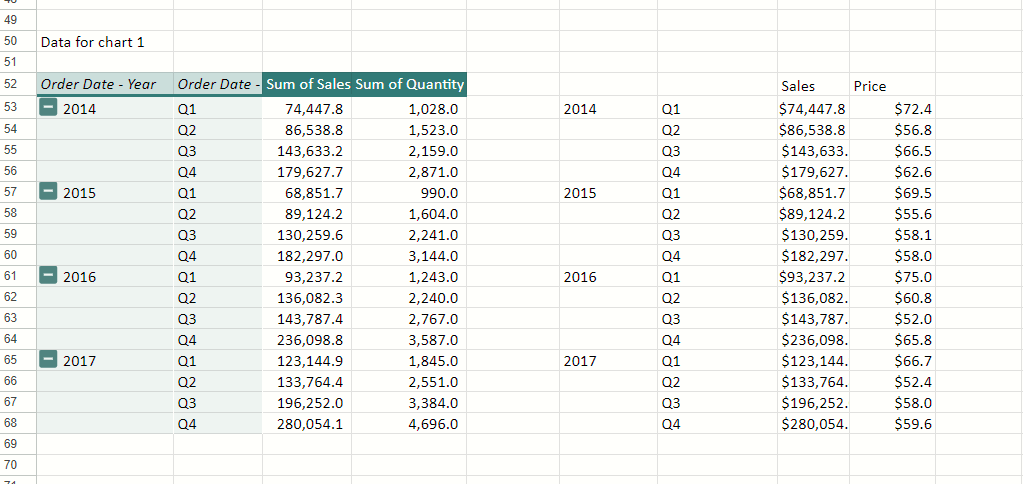
Sales and Price Trends by Quarter: Visualizes quarterly sales and price trends over 4 years, showing how sales volume and pricing changed throughout the period.
States with Highest All-Time Sales: A bar chart illustrating the states that have contributed the most to total sales, identifying high-performing regions.
Year-over-Year Comparison:
Visual Indicators: Arrows (green for growth, red for decline) highlight year-over-year performance changes, making it easy to spot growth or declines across categories, segments, and regions.
Increased Visibility: The dashboard provides clear visibility into key sales drivers by showing sales and profit performance across multiple dimensions such as categories, segments, and regions. Actionable Insights: With year-over-year comparisons and growth metrics, users can identify top-performing products, regions, and customer segments. This helps the business focus on high-growth areas while addressing declining sales in other segments or regions. Data-Driven Decision Making: By visualizing sales trends and profitability data, management can make data-backed decisions to improve sales strategies, allocate resources effectively, and optimize product offerings based on regional demand. Identifying Trends and Patterns: The quarterly sales and price trends allow users to spot seasonal patterns and changes in pricing strategies, enabling the business to adapt and forecast future performance more accurately. Improved Regional Focus: The state-level sales chart identifies the highest and lowest-performing states, allowing the company to focus efforts on expanding into lower-performing regions or increasing investments in high-growth states like California and New York.