"To conduct a comprehensive financial analysis of Adani Power Ltd, evaluating key financial metrics such as profitability, liquidity, leverage, and efficiency over time. The project aims to provide actionable insights into the company's financial health, identify trends, assess risks, and offer recommendations for strategic financial decision-making.
Microsoft Excel: For data manipulation, calculation of financial ratios, and visualization.
Power BI: For creating interactive dashboards and data visualization.
Financial Statements: Annual reports of Adani Power Ltd to extract relevant financial data.
Python: For advanced data analysis and financial modeling.
Time-Series Analysis: Visualization of financial data over time to understand the company's performance trajectory.
Financial Ratio Analysis: Detailed examination of profitability, liquidity, and leverage ratios over a multi-year period.
Data Visualization: Use of interactive charts to present trends in key financial metrics such as PAT, EBITDA, FCF, Debt-to-Equity ratio, etc.
Scenario Analysis: Evaluation of how different financial parameters like debt, revenue, and expenses impact profitability.
Comparative Analysis: Comparing the company’s financial performance with industry standards.
The project involved a comprehensive analysis of Adani Power Ltd's financial health by examining data from various financial statements over a defined period. Using Excel and Power BI, data was cleaned, processed, and visualized to gain insights into the company's profitability, liquidity, solvency, and overall financial stability. The project aimed to identify trends, detect potential financial risks, and suggest ways to improve financial performance, such as enhancing PAT and managing debt levels.
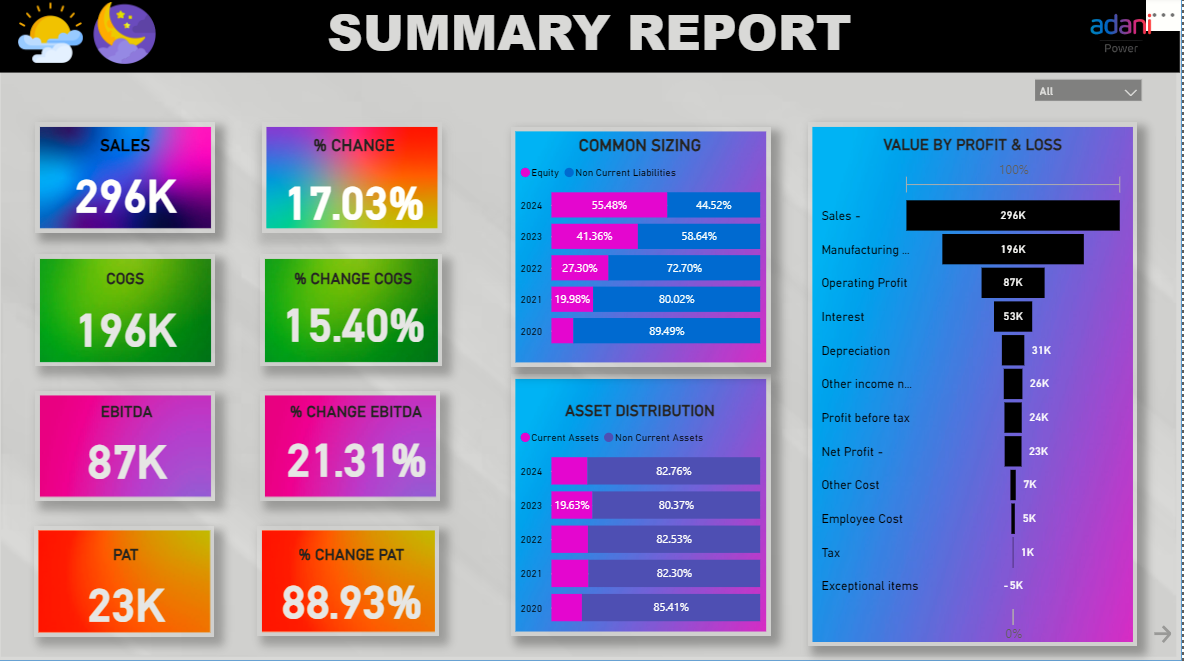
Summary Report:The visuals depict Adani Power Ltd as a company experiencing solid growth in both revenue and profit metrics. There are positive trends in sales, EBITDA, and PAT, with significant improvements in profit margins, indicating efficient management and operations. The company also shows financial stability through its equity growth and focus on current assets. However, there are considerable interest and depreciation costs, which may reflect the company’s capital-intensive nature in the energy sector.
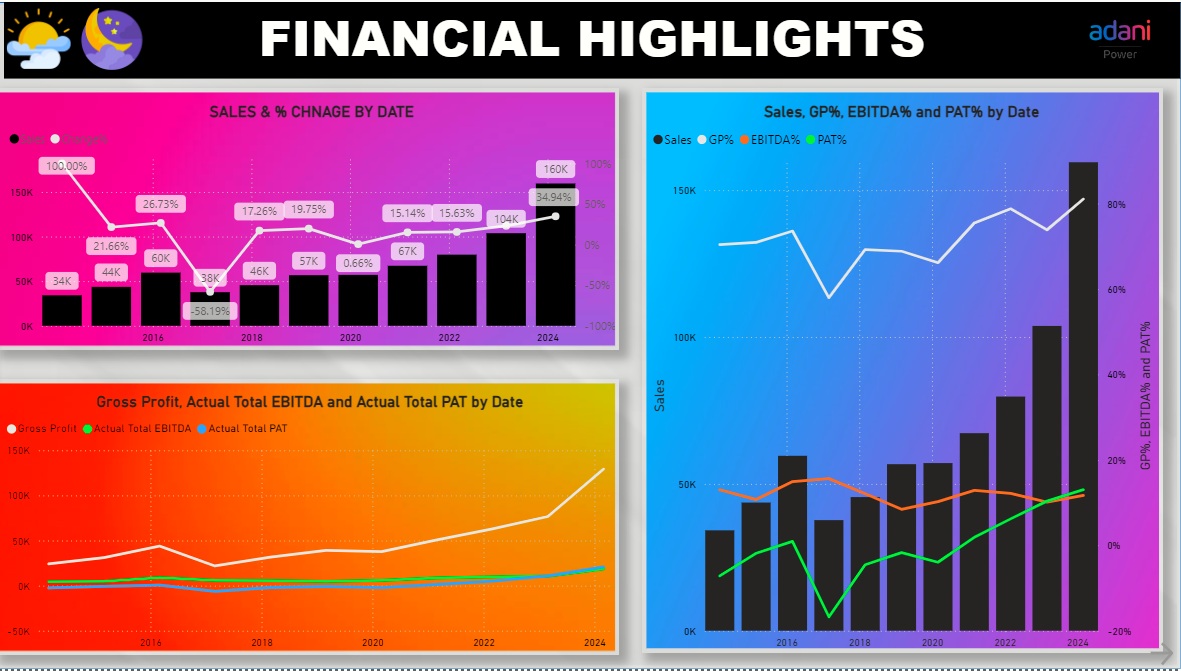
Financial Highlights:These visuals highlight a period of financial fluctuation for Adani Power Ltd. Key takeaways include:
A significant drop in sales around 2018, followed by a strong recovery in later years.
Improving profitability margins over time, as seen in the increasing EBITDA% and PAT%.
Gross profit has seen consistent growth, and PAT moved from negative to positive, reflecting an eventual financial turnaround.
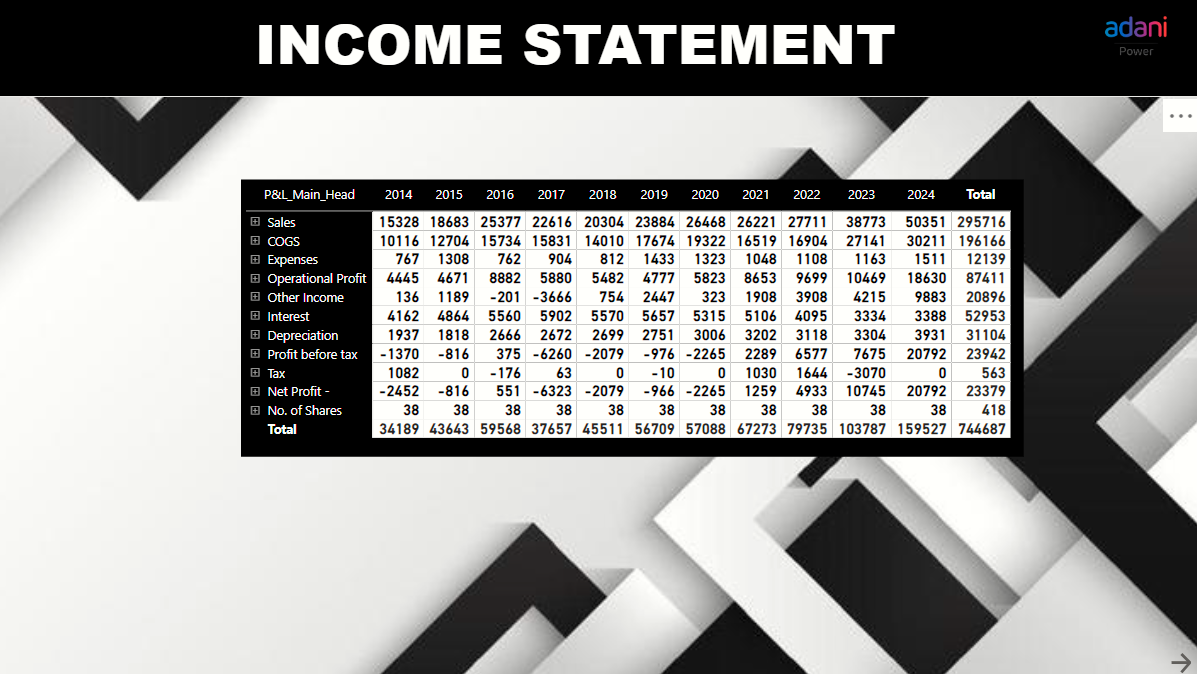
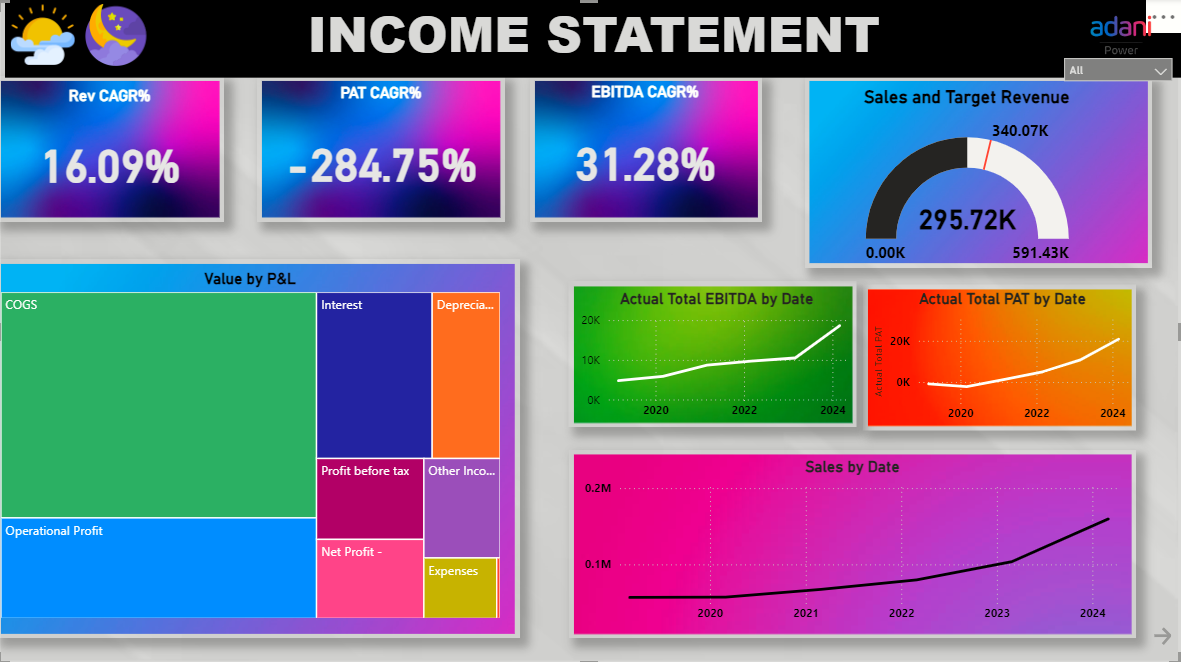
Income Statement:Adani Power Ltd shows strong growth in EBITDA and sales, as indicated by their respective CAGR figures and the upward trends in the graphs. The company is increasing its revenue and operational profitability.
The negative PAT CAGR implies profitability issues, possibly due to high-interest costs or other expenses. This needs attention to convert operational success into net profitability.
While the operational aspects and sales are showing healthy growth, there’s a need for the company to address factors affecting the net profit to ensure sustainable financial health.
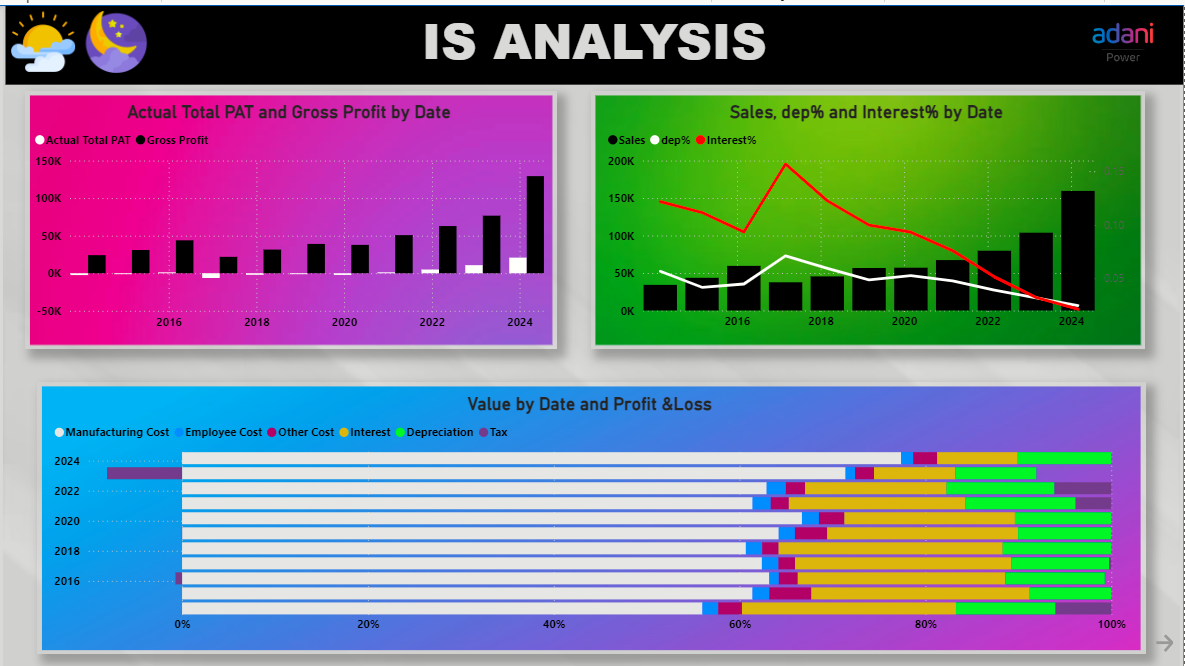
Is Analysis:Increasing sales and gross profit indicate that Adani Power is successfully expanding its operations and revenue.
Reduced interest percentages and lower manufacturing costs suggest that the company is managing its expenses more efficiently and may be restructuring its debt.
The stabilization of depreciation costs indicates efficient management of capital assets.
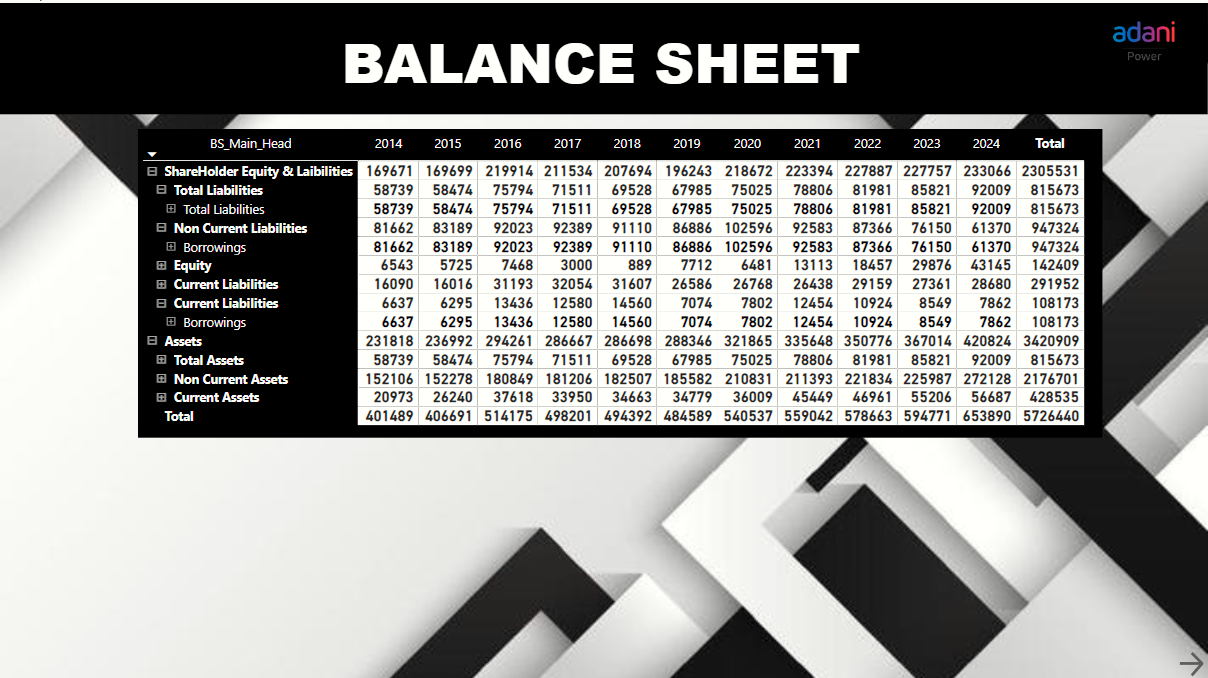
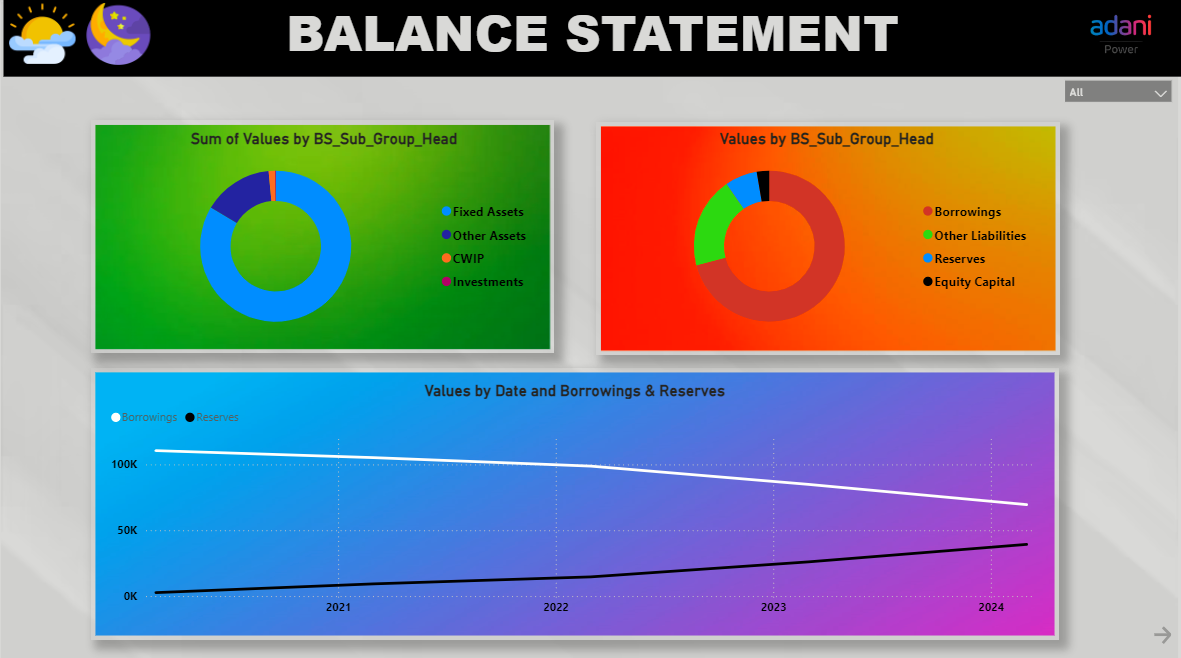
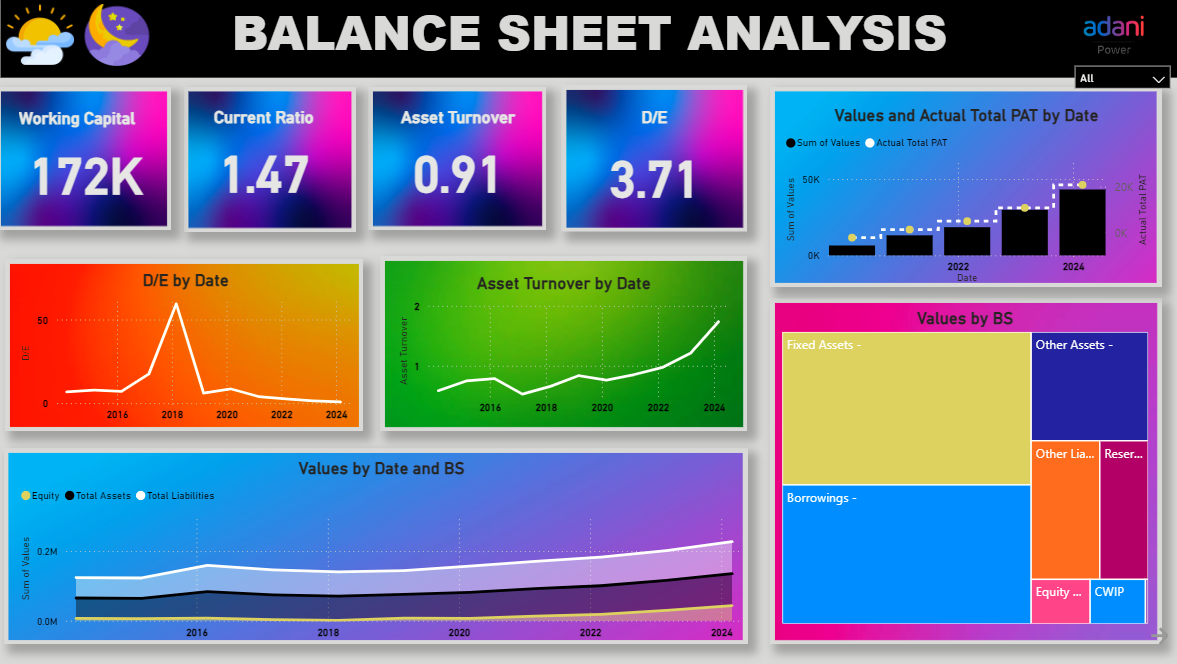
Balance Statement:This visual highlights Adani Power Ltd’s balance sheet health with a focus on assets, liabilities, and capital structure:
Asset composition is dominated by **fixed assets**, reflecting the infrastructure-heavy nature of the business.
Borrowings make up a significant portion of the company's capital, while reserves and equity are much smaller, suggesting high leverage.
A growing trend in borrowings and declining reserves may indicate rising debt levels and reduced internal financial buffers.
Balance Statement:The visuals collectively suggest that Adani Power Ltd has made significant strides in improving profitability, managing its debt, and utilizing assets more efficiently. However, the high debt levels and the need for further enhancement in asset utilization remain areas for ongoing attention.
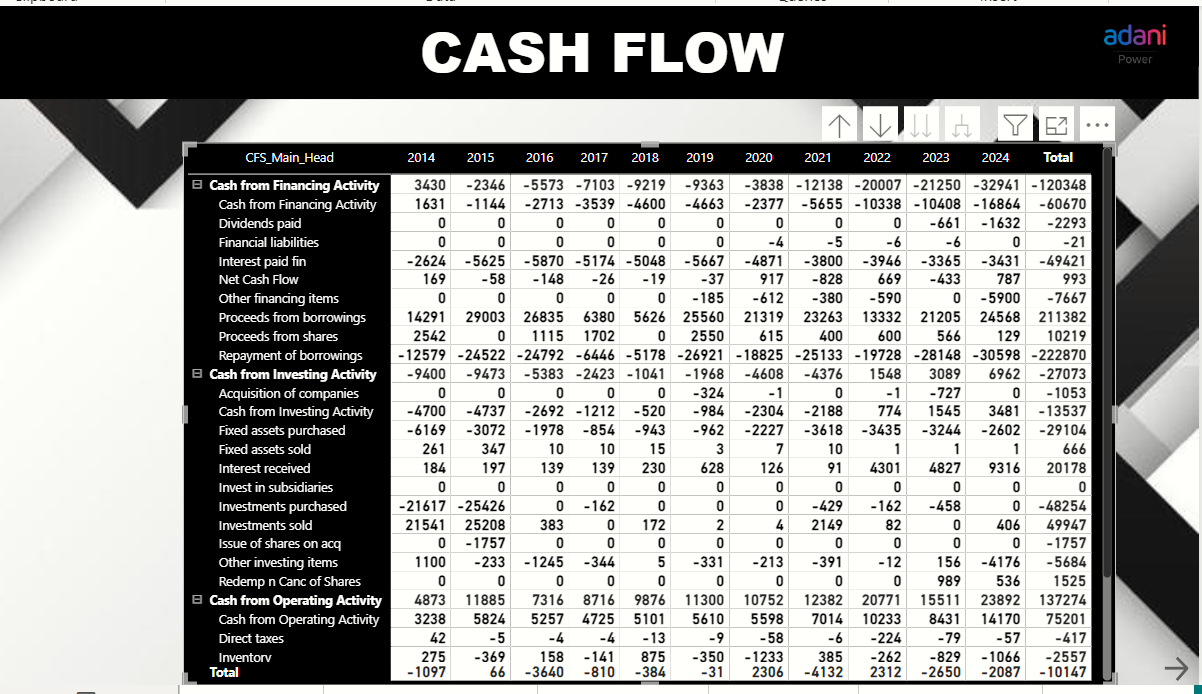
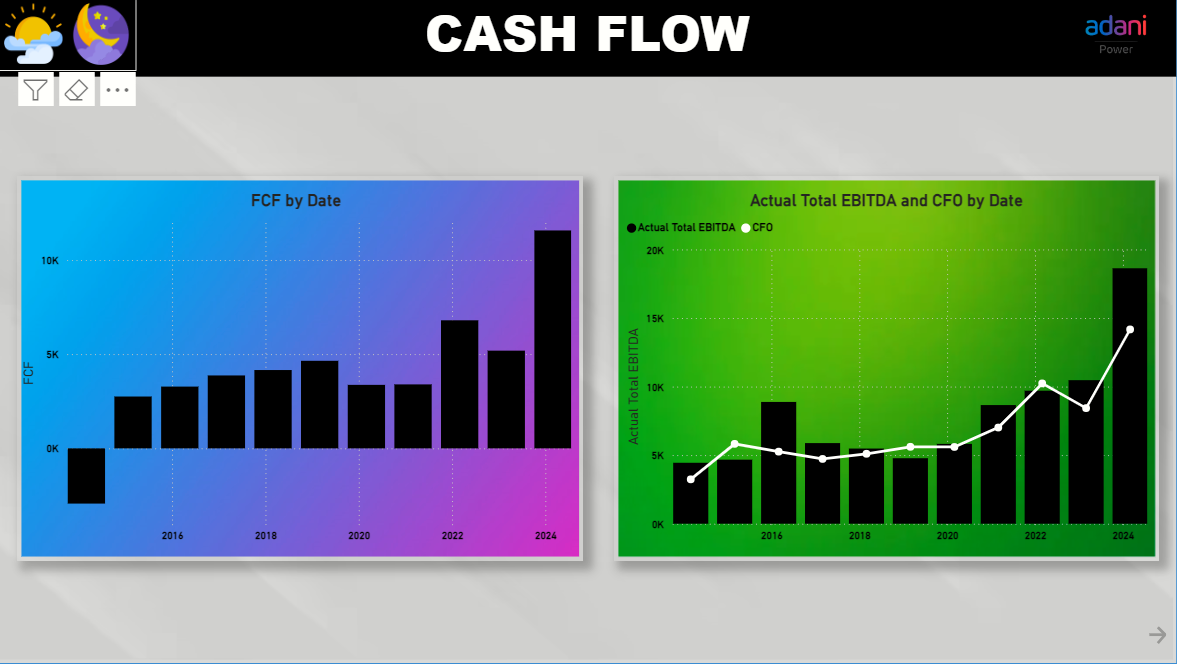
Cash Flow:The growing trend in FCF, EBITDA, and CFO indicates that Adani Power Ltd is experiencing strong financial health and operational efficiency. The company seems to be on a positive trajectory, which is a good sign for stakeholders, as it means the company is generating sufficient cash to meet its obligations, invest in growth, and potentially provide returns to shareholders.
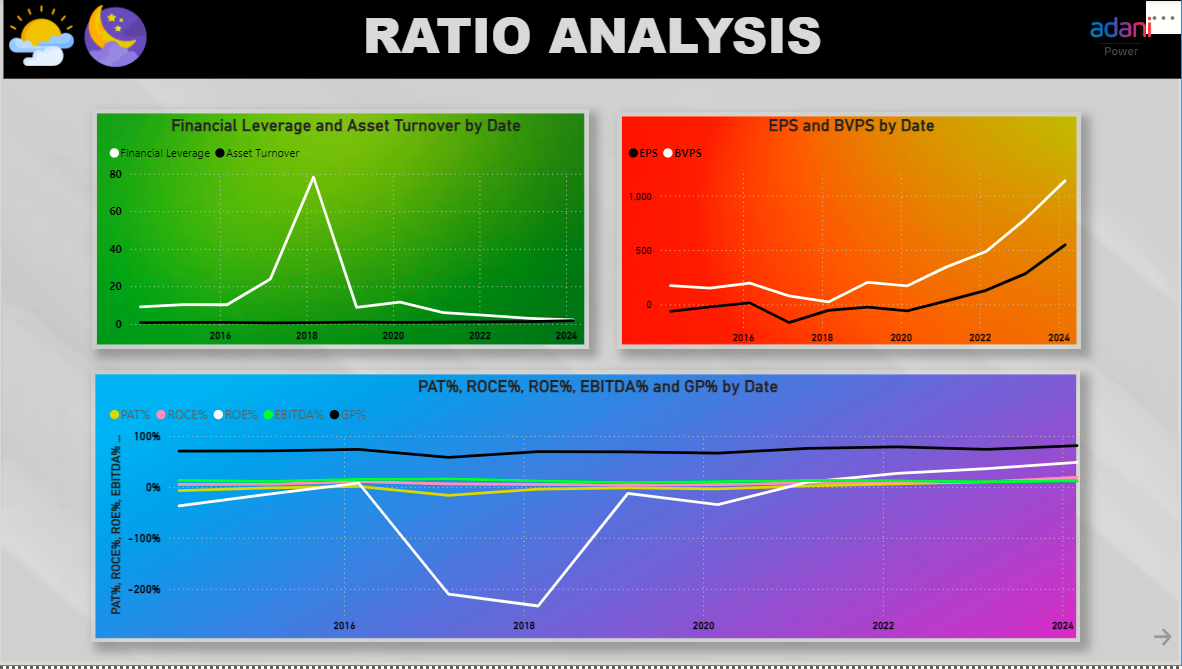
Ratio Analysis:2018 Financial Distress- The company faced significant financial challenges around 2018, as seen in the sharp drop in financial metrics. This could be due to high debt levels, reduced profitability, or increased expenses during that time.
Improving Financial Health-Since 2020, there is a clear improvement in profitability (PAT%, EPS), operational efficiency (ROCE%, ROE%, EBITDA%), and asset utilization (Asset Turnover). This suggests that Adani Power Ltd has taken effective measures to improve its financial health, possibly through debt restructuring, cost-cutting, or better asset management.
The analysis provided key insights into Adani Power Ltd's financial performance, revealing a steady improvement in profitability over time but highlighting concerns regarding high debt levels. The project helped identify critical areas for financial improvement, such as reducing the Debt-to-Equity ratio and enhancing free cash flow. This analysis aids stakeholders in making informed decisions regarding investment, operational efficiency, and strategic financial planning for Adani Power Ltd.