Check Out Some of My Works
To provide a comprehensive and visual overview of car sales performance, including key metrics such as total sales, number of cars sold, average car price, and sales trends over time. The dashboards aim to assist management and stakeholders in tracking business performance, identifying sales trends, and supporting decision-making for strategic initiatives in the automotive market.
Facilitate quick data-driven insights for decision-makers.
Identify patterns in car sales based on model, region, and other factors.
Provide interactive and user-friendly data visualization for monitoring sales performance.
Power BI: The dashboards are built using Power BI, as evidenced by its advanced visualizations, interactive filters, and intuitive layout. Power BI allows for:
Connecting to data sources (such as SQL, Excel, or databases containing car sales data).
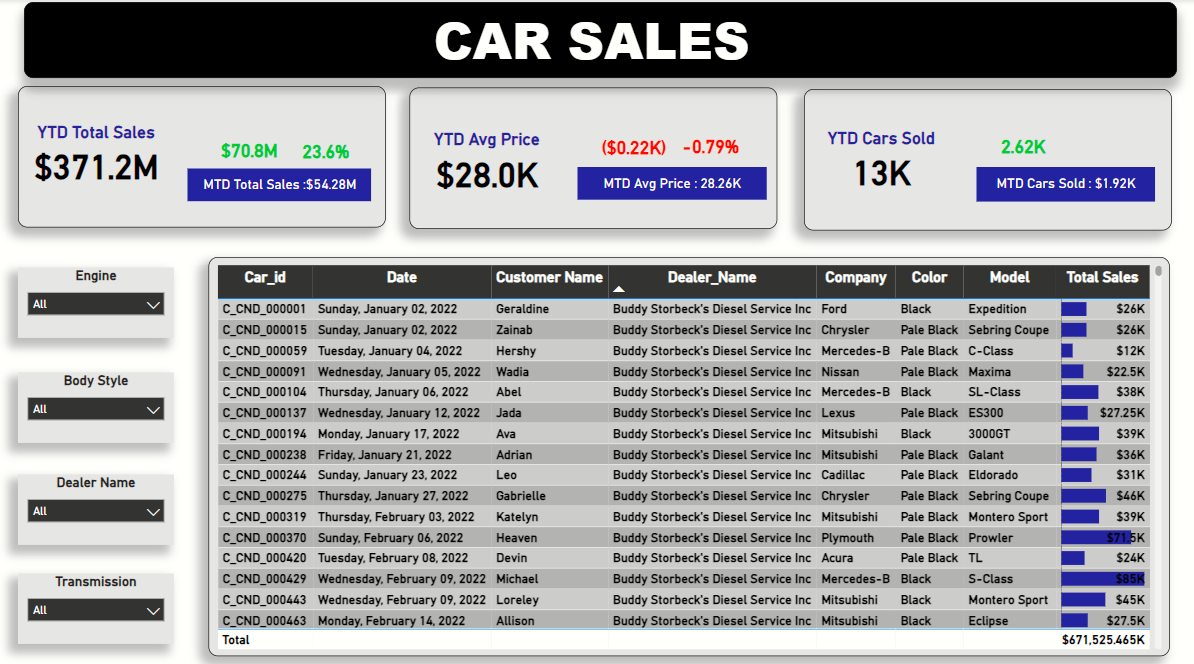
Building custom visuals for KPI displays, trend analysis, and detailed tables.
Creating interactive filters (slicers) to allow users to explore data dynamically.
Power BI Maps (Geo-mapping): For dealer region visualization, likely leveraging Bing Maps within PowerBI.
DAX (Data Analysis Expressions): Used to calculate KPIs such as YTD totals,YoY growth, MTD sales, and other time intelligence metrics.
Data Connection Tools: Power BI typically connects to data sources such as SQL databases,Excel spreadsheets to pull in sales data for visualization.
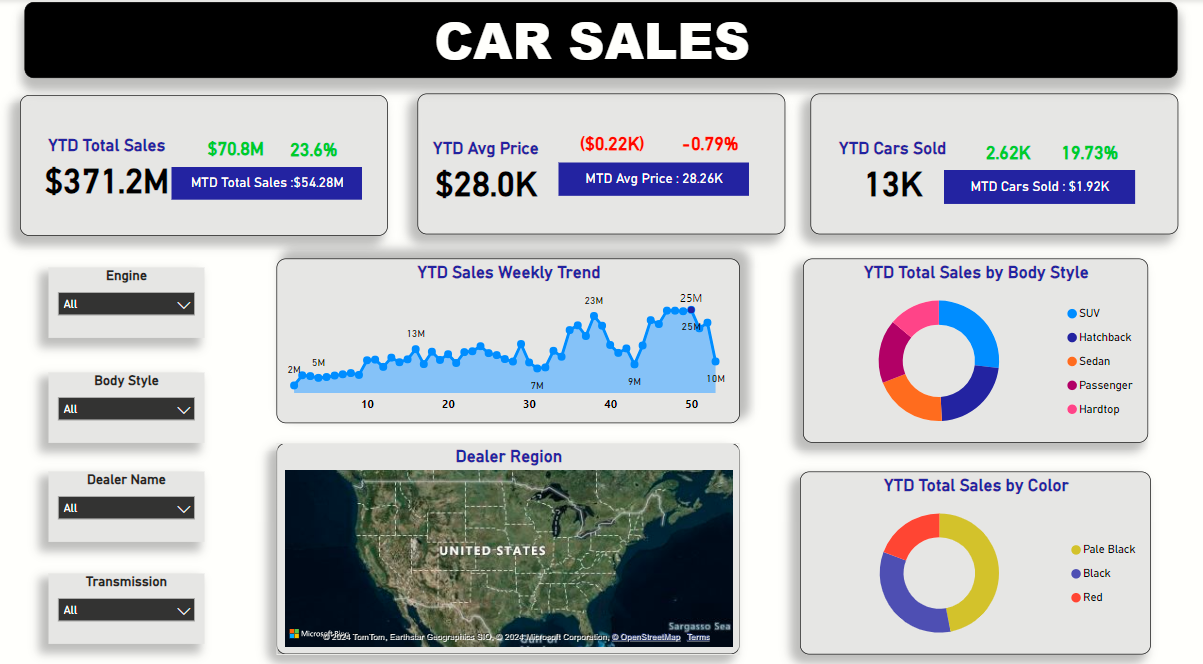
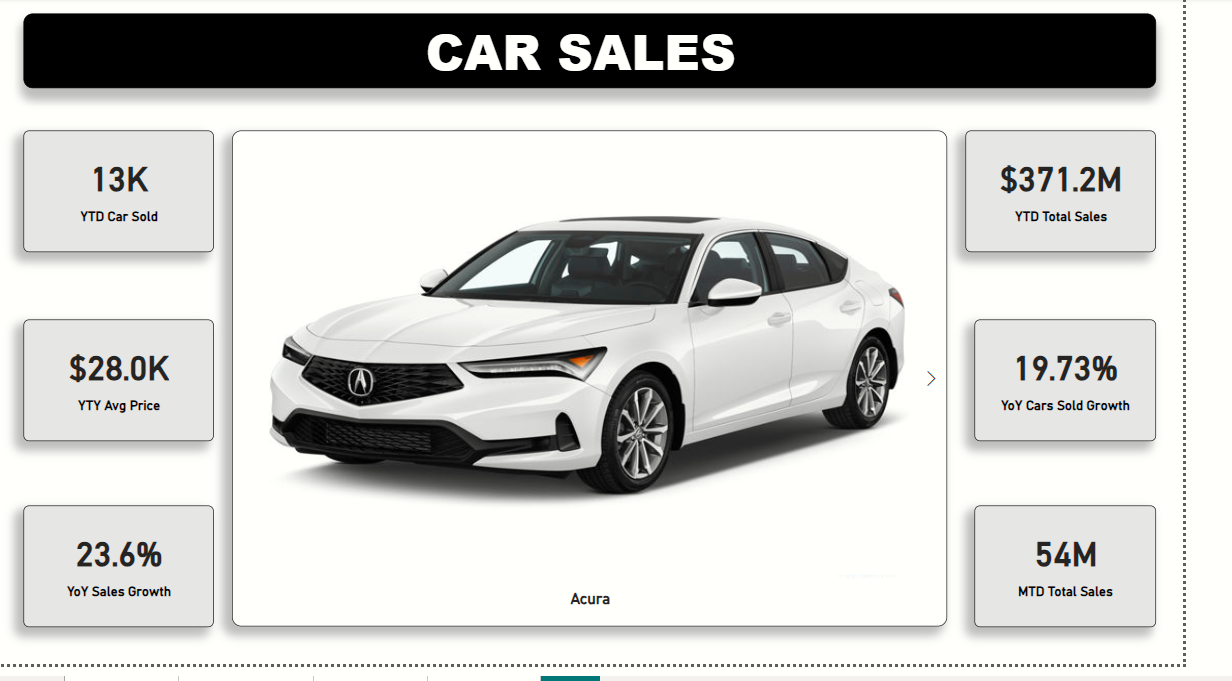
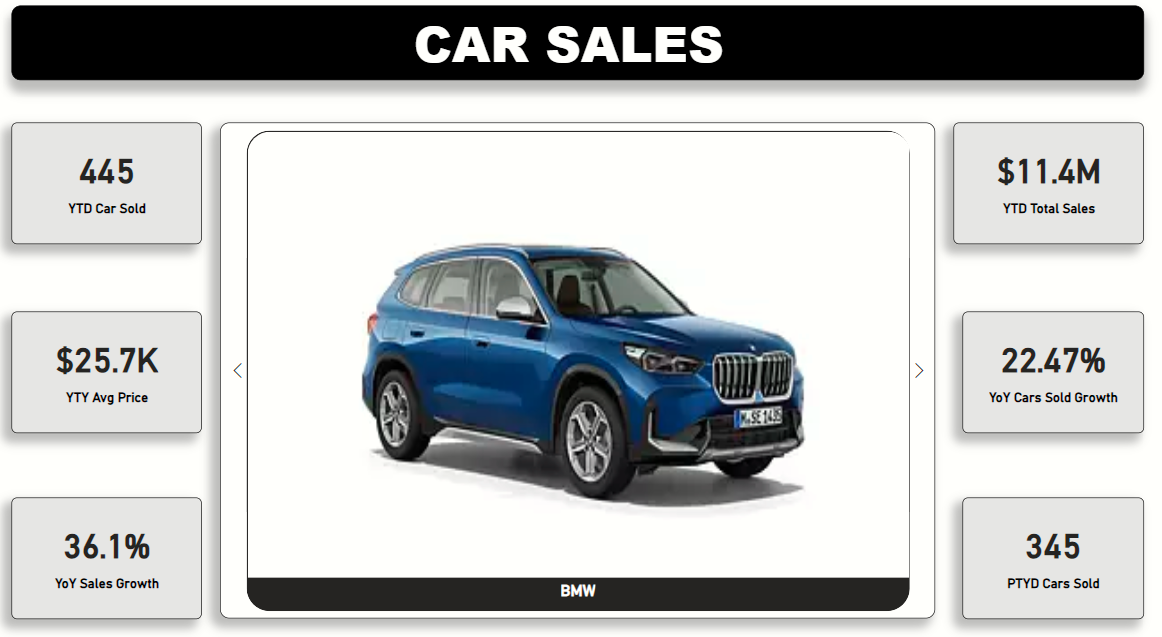
Key Performance Indicators (KPIs): All dashboards prominently display KPIs such as YTD Total Sales, YTD Cars Sold, YTD Avg Price, and YoY Growth in various areas, providing instant insights into sales performance.
Interactive Filters: The ability to filter data by Engine Type, Body Style, Dealer Name, and Transmission allows users to drill down into specific sales data based on key car attributes.
Sales Trends: Line charts show the weekly sales trend, helping visualize how sales have fluctuated throughout the year.
Dealer Region Map: This heat map or geographical chart highlights the region-wise performance of different car dealerships.
Monthly Breakdown: Dashboards include Month-to-Date (MTD) metrics, providing insights into how the current month is performing relative to the overall YTD metrics.
Visual Representations: Use of pie charts, bar charts, and line graphs to represent sales distribution by body style, color, and sales trends.
Enhanced Decision-Making: These dashboards enable management to quickly assess the state of the business, facilitating timely decisions related to sales strategies, marketing campaigns, or inventory management.
Real-Time Tracking: By having MTD and YTD metrics, stakeholders can monitor sales performance and adjust targets or strategies in real-time to hit company objectives.
Improved Sales Focus: With the ability to break down sales by attributes (e.g., body style, color), management can identify which types of vehicles are performing well and focus marketing efforts accordingly. For example, if SUVs and Black cars are top-sellers, marketing can be optimized to push similar models/colors.
Geographical Insights: Dealer region maps provide insights into geographical sales performance, helping to identify regions with lower sales, potentially targeting them with regional promotions or additional dealership support.
Operational Efficiency: By offering a clear, concise view of all essential metrics on one screen, operational teams can work more efficiently, reducing the time spent analyzing disparate data sources.
Trend Analysis: Weekly sales trends and YoY growth metrics allow the identification of seasonal trends, enabling businesses to prepare for high or low sales periods proactively.