Check Out Some of My Works
The project aimed to build a dynamic dashboard for tracking and comparing revenue, targets, profitability, and customer trends across multiple dimensions, including stores, months, and customer demographics. The goal was to offer clear insights into revenue performance and variances against targets.
Excel for data visualization and dashboard creation
Use of Pivot Tables, Conditional Formatting, Charts/Graphs to summarize and visualize data dynamically.
Formulas (for calculations like variance, target comparisons, etc.) and Slicers/Filters to interact with the data by month, store, or other filters.
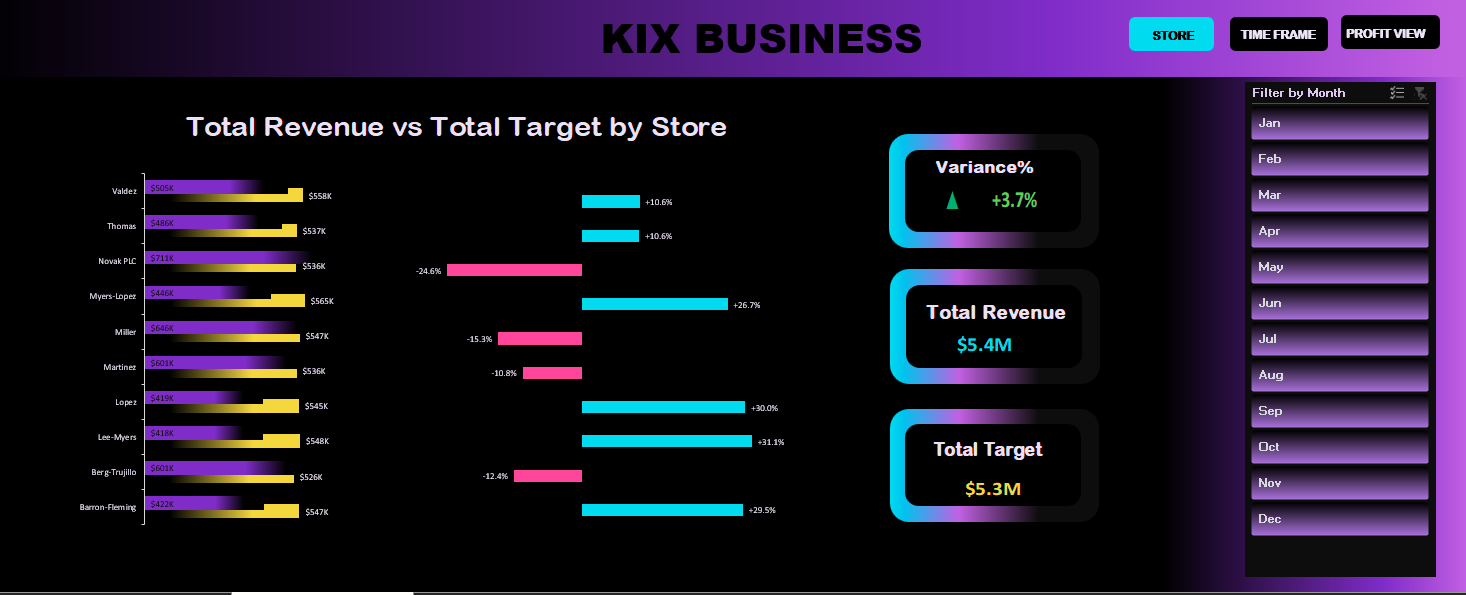
Revenue vs. Target Comparison:Displays the performance of individual stores by comparing total revenue against set targets. Variance and percentage change are highlighted with color coding to easily identify over- and under-performing stores.
Profit and Customer Analysis:
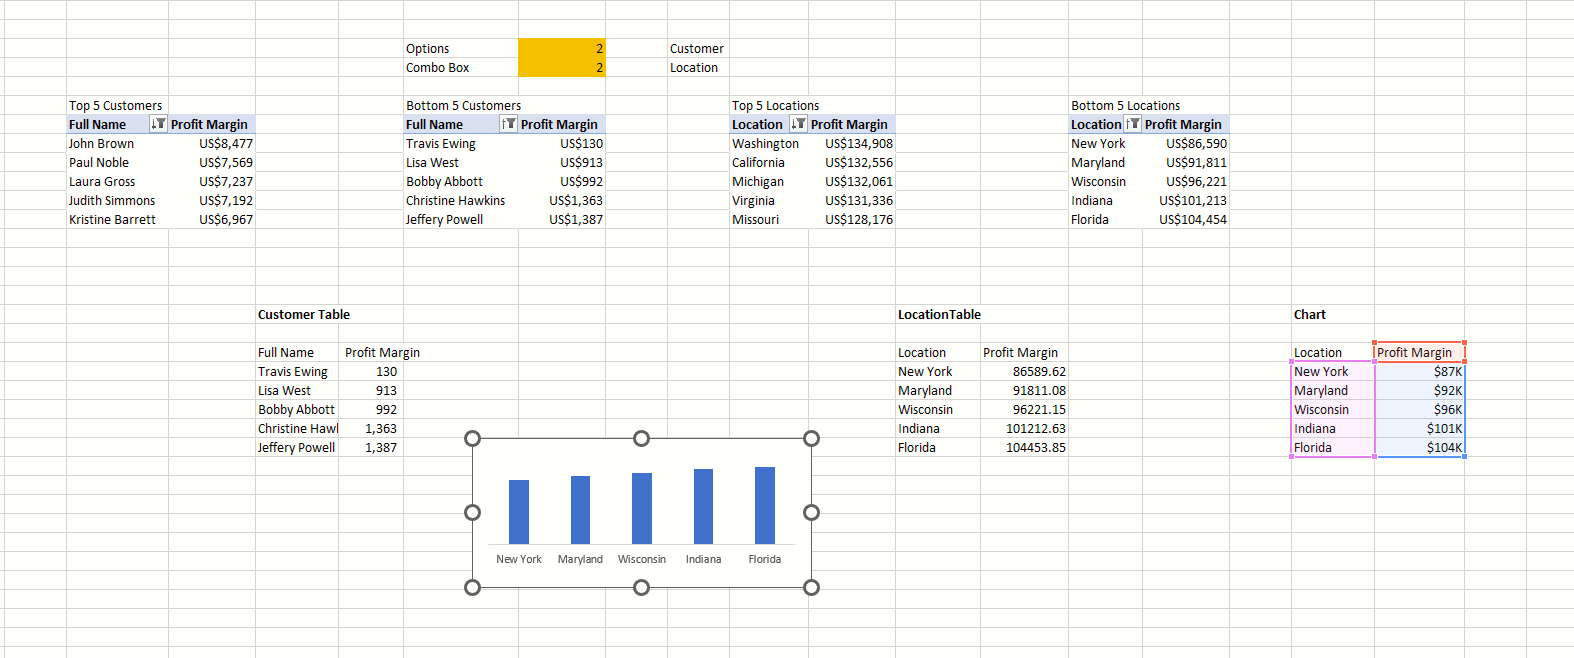
Breakdowns by gender and customer age show how different segments contribute to overall revenue.
Display of top and bottom performing locations, as well as analysis of day-wise and month-wise revenue trends.
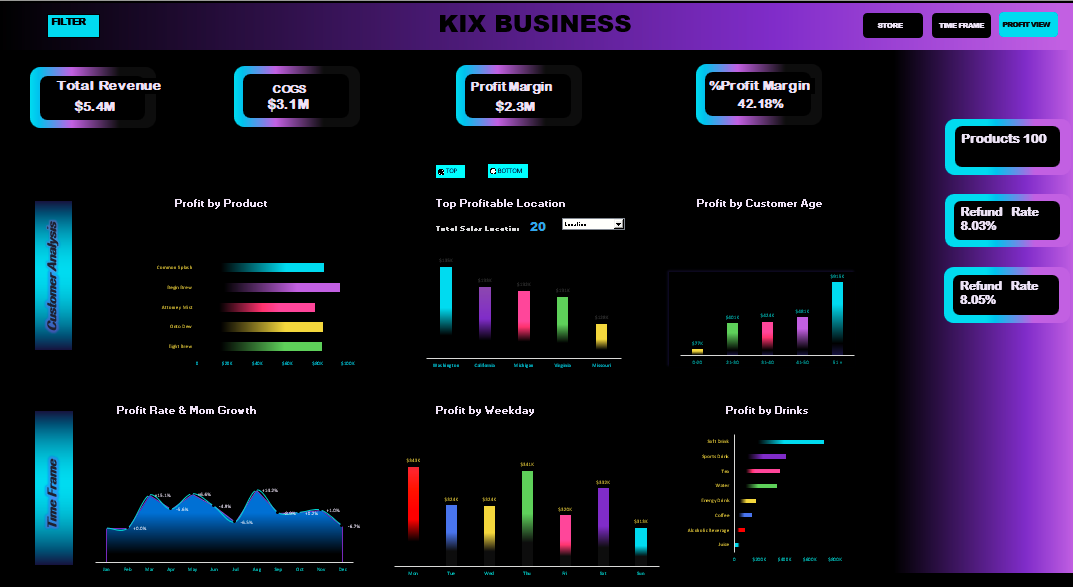
Product and Category Insights:
Information on the number of products sold, along with return and refund rates.
Profit by product categories like beverages is also included to assess which products contribute most to the bottom line.
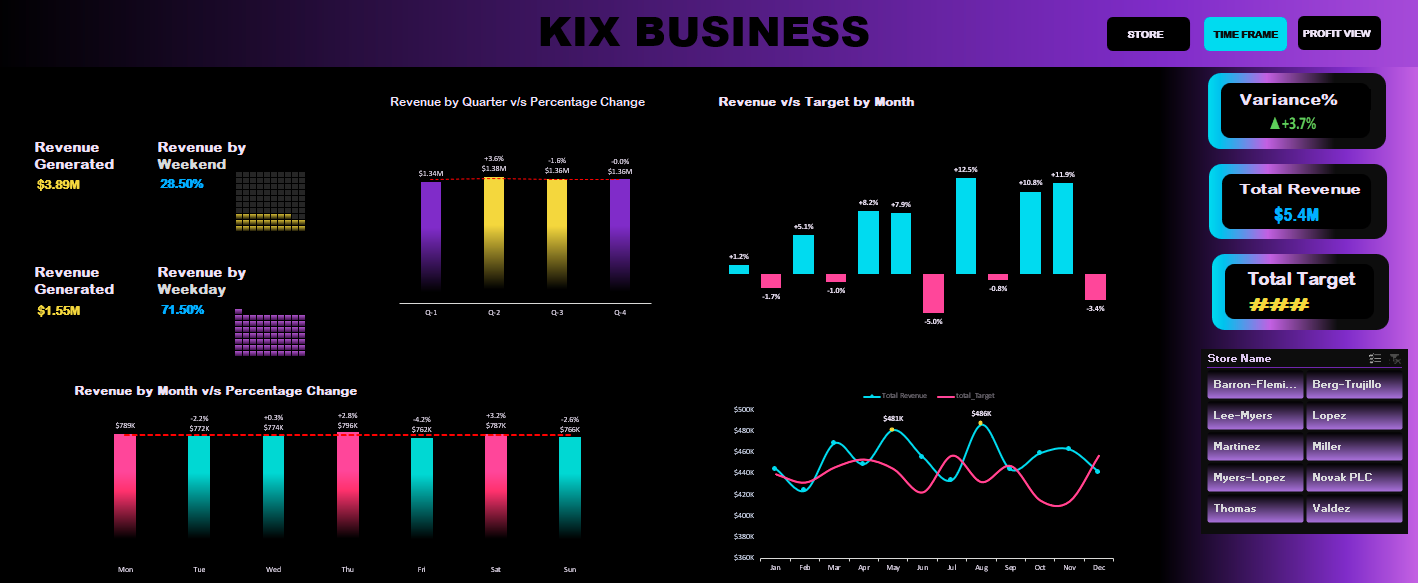
Revenue by Weekdays/Weekends and Quarters:
Comparison of revenues on weekdays vs weekends, and quarterly breakdowns show seasonal patterns and percentage changes in performance.
Key Metrics Overview:
Total Revenue, Total Target, COGS (Cost of Goods Sold), Profit Margin, and Percentage Profit Margin are displayed prominently at the top for quick access to the overall business performance.
Enhanced Decision-Making: The dashboard provides a comprehensive view of business performance across stores, products, and customer segments, enabling decision-makers to quickly identify areas of success and improvement.
Clear Visualizations: The color-coded variance indicators and profit metrics simplify the interpretation of data, making it easier to spot trends or outliers in performance.
Time Efficiency: By consolidating key metrics into a single dashboard, the project reduced the time required for performance reviews and strategic meetings.